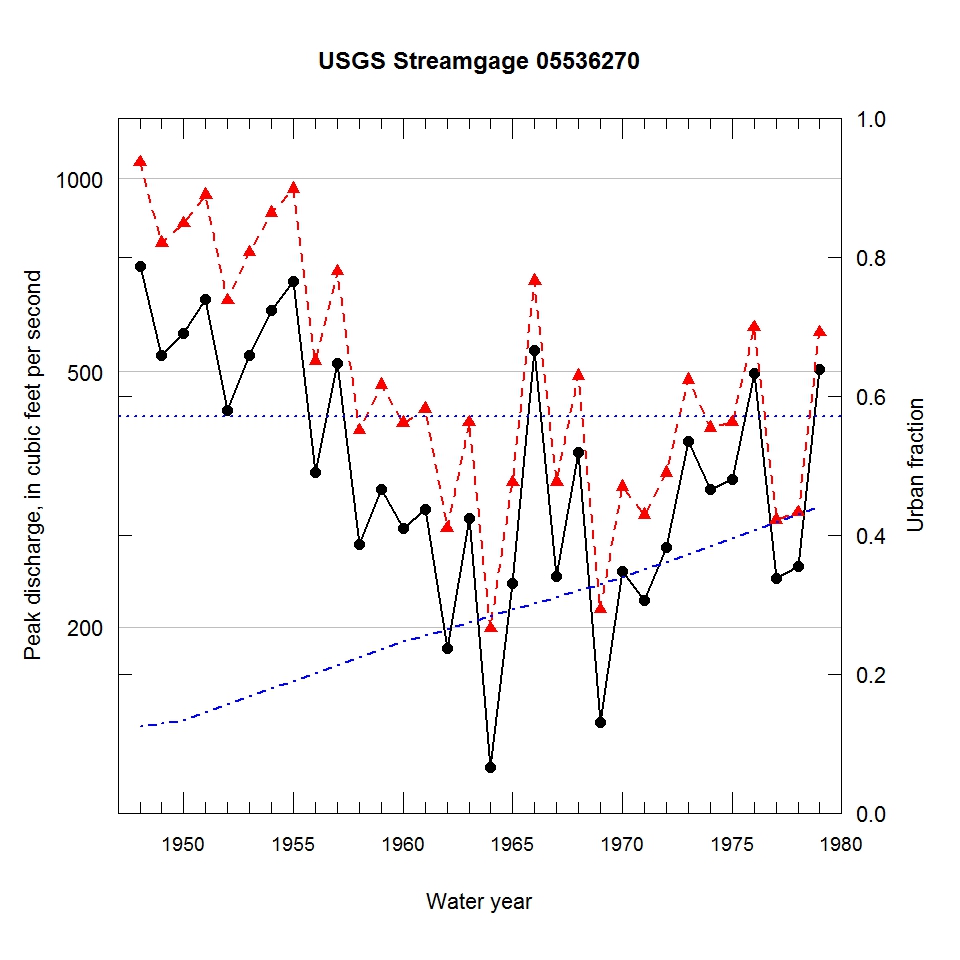
Observed and urbanization-adjusted annual maximum peak discharge and associated urban fraction and precipitation values at USGS streamgage:
05536270 NORTH CREEK NEAR LANSING, IL


| Water year | Segment | Discharge code | Cumulative reservoir storage (acre-feet) | Urban fraction | Precipitation (inches) | Observed peak discharge (ft3/s) | Adjusted peak discharge (ft3/s) | Exceedance probability |
| 1948 | 1 | 5 | 0 | 0.125 | 1.849 | 730 | 1060 | 0.049 |
| 1949 | 1 | 5 | 0 | 0.129 | 0.768 | 531 | 794 | 0.132 |
| 1950 | 1 | 5 | 0 | 0.134 | 1.151 | 575 | 852 | 0.101 |
| 1951 | 1 | 5 | 0 | 0.145 | 2.026 | 649 | 943 | 0.072 |
| 1952 | 1 | 5 | 0 | 0.156 | 0.021 | 435 | 646 | 0.238 |
| 1953 | 1 | 5 | 0 | 0.168 | 0.615 | 531 | 768 | 0.147 |
| 1954 | 1 | 5 | 0 | 0.179 | 0.916 | 623 | 884 | 0.090 |
| 1955 | 1 | 5 | 0 | 0.190 | 3.324 | 692 | 965 | 0.068 |
| 1956 | 1 | 5 | 0 | 0.201 | 1.423 | 348 | 520 | 0.420 |
| 1957 | 1 | 5E | 0 | 0.213 | 2.393 | 515 | 717 | 0.178 |
| 1958 | 1 | 5 | 0 | 0.224 | 1.101 | 269 | 405 | 0.631 |
| 1959 | 1 | 5 | 0 | 0.235 | 0.612 | 328 | 477 | 0.492 |
| 1960 | 1 | 5E | 0 | 0.246 | 1.053 | 285 | 416 | 0.611 |
| 1961 | 1 | 5 | 0 | 0.256 | 1.493 | 305 | 438 | 0.568 |
| 1962 | 1 | 5E | 0 | 0.265 | 0.242 | 185 | 285 | 0.841 |
| 1963 | 1 | 5E | 0 | 0.274 | 1.492 | 295 | 417 | 0.610 |
| 1964 | 1 | 5E | 0 | 0.283 | 0.991 | 121 | 199 | 0.941 |
| 1965 | 1 | 5E | 0 | 0.292 | 0.896 | 234 | 336 | 0.761 |
| 1966 | 1 | 5 | 0 | 0.302 | 1.631 | 540 | 693 | 0.193 |
| 1967 | 1 | 5 | 0 | 0.311 | 1.149 | 240 | 337 | 0.760 |
| 1968 | 1 | 5 | 0 | 0.320 | 2.114 | 374 | 493 | 0.464 |
| 1969 | 1 | 5E | 0 | 0.329 | 0.945 | 142 | 213 | 0.931 |
| 1970 | 1 | 5E | 0 | 0.338 | 1.472 | 244 | 331 | 0.769 |
| 1971 | 1 | 5E | 0 | 0.350 | 0.924 | 220 | 299 | 0.822 |
| 1972 | 1 | 5 | 0 | 0.361 | 1.088 | 266 | 348 | 0.741 |
| 1973 | 1 | 5 | 0 | 0.373 | 0.887 | 390 | 486 | 0.478 |
| 1974 | 1 | 5 | 0 | 0.384 | 1.296 | 328 | 409 | 0.625 |
| 1975 | 1 | 5 | 0 | 0.396 | 1.120 | 340 | 417 | 0.609 |
| 1976 | 1 | 5 | 0 | 0.407 | 1.556 | 497 | 586 | 0.314 |
| 1977 | 1 | 5E | 0 | 0.418 | 1.017 | 238 | 294 | 0.828 |
| 1978 | 1 | 5 | 0 | 0.430 | 1.158 | 249 | 302 | 0.816 |
| 1979 | 1 | 5 | 0 | 0.441 | 0.803 | 505 | 576 | 0.329 |

